Building an Enterprise AI FinOps Dashboard for Tracking Machine Learning Costs
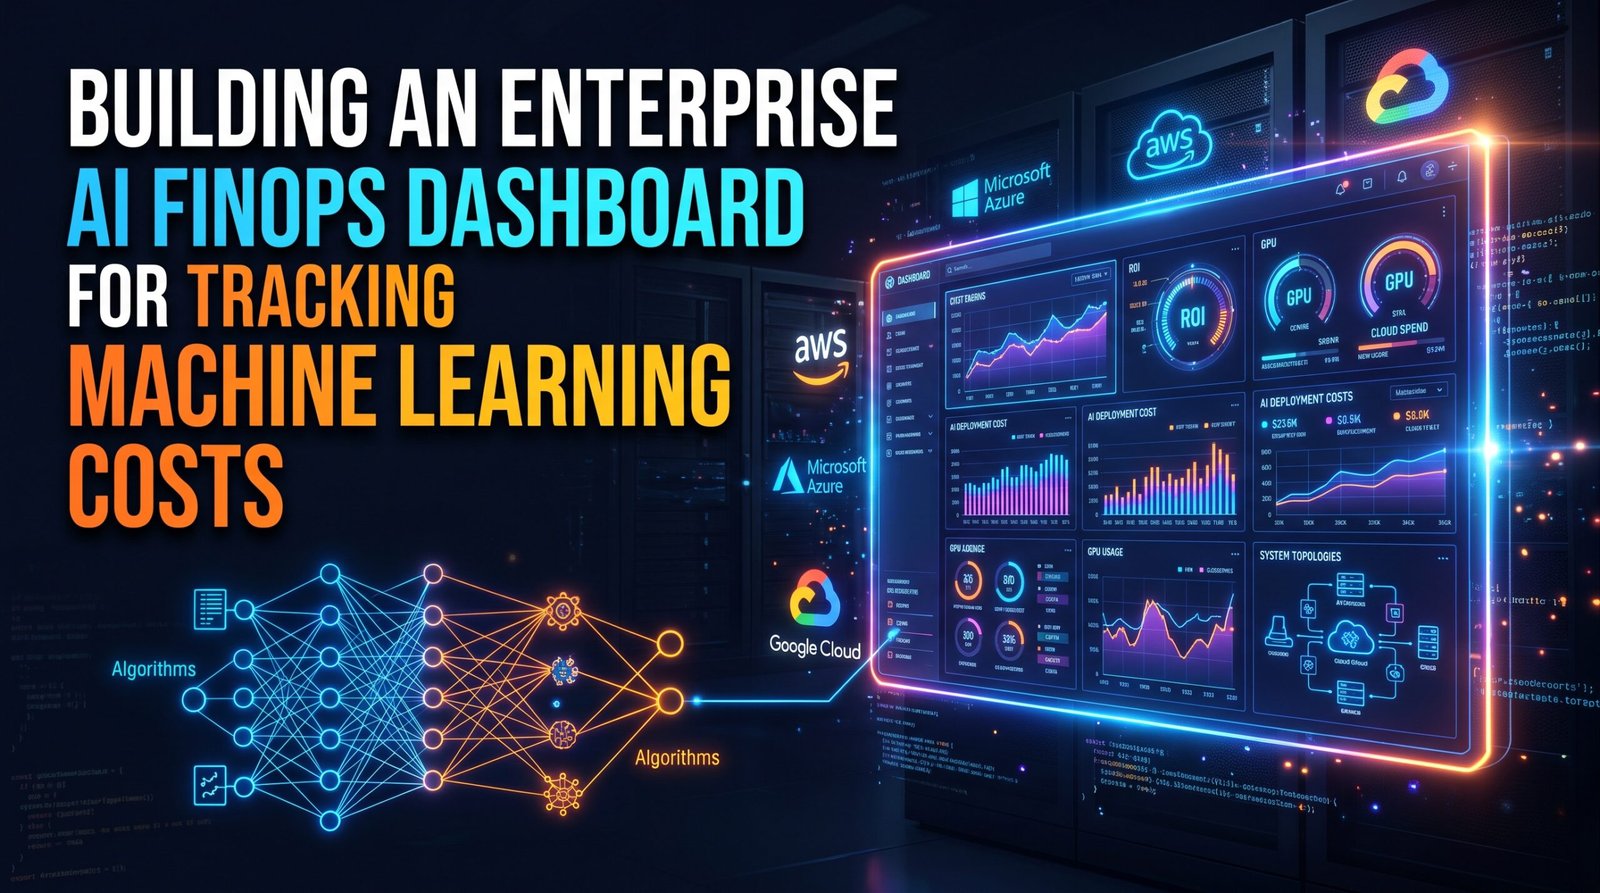
The operationalization of artificial intelligence at an enterprise scale is no longer merely a model development challenge; it is a profound architectural and financial engineering mandate. As organizations transition from isolated AI experiments to ubiquitous, multi-tenant production deployments, the corresponding infrastructure costs—driven by massive GPU clusters, high-throughput vector databases, and relentless API calls—are skyrocketing. Technical leaders, Directors, and Enterprise Architects are quickly discovering that without granular visibility into their MLOps infrastructure, compute overhead can effortlessly erase any theoretical business value the models generate. The solution is not to stifle innovation by arbitrarily capping cloud spend, but to engineer an Enterprise AI FinOps dashboard capable of tracking machine learning costs with the same surgical precision used for application performance telemetry.
A properly architected Enterprise AI FinOps dashboard eliminates the noise of theoretical frameworks and provides battle-tested, high-signal intelligence into where every compute dollar is flowing. It bridges the gap between infrastructure orchestration and financial accountability, enabling teams to deploy and scale AI reliably while maintaining strict cost and risk efficiency. In the modern cloud ecosystem, if a dashboard does not present a clear strategic shift toward automated cost control or a measurable advantage in AI ROI, it is fundamentally useless. This blueprint outlines the critical engineering requirements, API integrations, and architectural patterns necessary to build a FinOps dashboard that treats financial telemetry as a core pillar of your enterprise AI infrastructure.
KPIs Every FinOps Dashboard Must Include
To establish a rigorous triage system for your cloud-native deployments, your FinOps dashboard must move beyond generic cloud billing metrics and focus specifically on the unique economics of machine learning workloads. Standard metrics like “total EC2 spend” offer zero operational value when trying to diagnose an inefficient LLM deployment. Instead, architects must track high-signal key performance indicators (KPIs) that map directly to AI operations.
The following KPIs are non-negotiable for a robust, enterprise-grade AI FinOps dashboard:
- Cost Per Inference (CPI): This is the holy grail of machine learning unit economics. Your dashboard must aggregate the total infrastructure cost (compute, memory, network ingress/egress, and caching) required to serve a single prediction or token. Tracking CPI allows you to baseline the profitability of specific AI features and detect code-level regressions that cause inference costs to spike.
- GPU Utilization and Idle Time Ratios: In an era of hardware scarcity, idle GPUs are a catastrophic waste of capital. The dashboard must pull telemetry from orchestration layers (like Kubernetes/Ray) to display real-time and historical utilization. High idle times combined with high costs signal a need for improved multi-tenancy, dynamic batching, or a shift to serverless GPU architectures.
- Training vs. Inference Spend: Organizations must split their financial tracking between the R&D phase (training/fine-tuning) and the operational phase (inference). A sudden surge in training costs without a corresponding deployment update indicates an experimental loop running unchecked, while soaring inference costs point to scaling inefficiencies.
- Data Pipeline and Storage Economics: Enterprise AI requires massive data movement. Your FinOps pane must track the storage costs associated with feature stores, model registries, and the massive network transfer fees incurred when moving training datasets across availability zones or cloud providers.
- Token Cost Efficiency (for LLMs): When utilizing proprietary foundational models, tracking the cost per 1k prompt and completion tokens is critical. This metric should be heavily correlated with caching hit rates—if your semantic cache is highly available and well-architected, your token cost efficiency should steadily improve.
By engineering your dashboard to surface these specific metrics, enterprise architects can mitigate deployment failures related to budget exhaustion and ensure that infrastructure scaling is directly tied to business output.
Tagging and Allocating Costs by Department
Even the most advanced telemetry is useless if the financial data cannot be attributed to the specific teams, products, or models consuming the resources. Untagged cloud resources represent the ultimate infrastructure black hole, preventing accurate chargebacks and destroying any hope of financial accountability. Implementing a strict, automated tagging taxonomy is a fundamental architectural advantage that separates the top 1% of enterprise AI operations from the rest.
Effective allocation requires a multi-dimensional tagging strategy implemented at the Infrastructure as Code (IaC) level. Manual tagging via cloud provider consoles is a reactive anti-pattern that guarantees failure. Instead, tagging must be enforced via CI/CD pipelines using tools like Terraform, Pulumi, or cloud-native policy engines (e.g., AWS Service Control Policies or Azure Policy). If a resource request does not contain the mandatory FinOps tags, the deployment must fail programmatically.
A battle-tested enterprise tagging taxonomy for AI workloads should include the following dimensions:
- Environment (env): Development, Staging, Production, or Experimentation. This allows FinOps teams to quickly identify and terminate orphaned development clusters.
- Cost Center (cost_center): The specific department (e.g., Marketing, R&D, Customer Success) responsible for the invoice. This is vital for enterprise chargebacks.
- AI Workload Type (ai_workload): Categorizing the compute as Training, Fine-Tuning, Batch Inference, or Real-Time Inference.
- Model Version (model_version): Tagging specific iterations of a model (e.g., ResNet-v2.1 or Llama3-Internal-v4) ensures that architects can financially compare the efficiency of newly deployed architectures against legacy systems.
- Project ID (project_id): Ties the infrastructure back to a specific business initiative, ensuring that the ROI of the AI feature can be measured against its operational cost.
One of the most complex challenges in tagging machine learning costs is allocating shared resources. Multi-tenant Kubernetes clusters running distributed training jobs or serving multiple microservices do not naturally map out individual costs per team. To solve this, technical leaders must deploy advanced cost-allocation tools like Kubecost or OpenCost. These tools intercept orchestration metrics and cross-reference them with cloud billing data, proportionally distributing the cost of shared CPU, GPU, and RAM based on the actual micro-consumption of each department’s namespace.
Integrating Cloud Billing APIs (AWS, Azure, GCP)
An autonomous FinOps dashboard cannot rely on daily CSV exports or manual data dumps; it requires real-time, programmatic data ingestion. To build a robust pipeline, your engineering teams must integrate deeply with the native billing and consumption APIs provided by the major cloud hyperscalers. Each environment presents unique challenges, data formats, and latency hurdles, requiring a unified architectural pattern for normalization.
When aggregating data into a single pane of glass, engineers must implement an automated ETL (Extract, Transform, Load) pipeline that standardizes telemetry into the FinOps Open Cost & Usage Specification (FOCUS) framework. This neutralizes vendor-specific quirks and enables true multi-cloud cost visibility.
AWS Cost Integration:
In Amazon Web Services, relying solely on the Cost Explorer API is a flawed strategy for granular ML tracking due to its latency and aggregation limits. Instead, enterprise architects must configure the AWS Cost and Usage Report (CUR). The CUR delivers highly granular, hourly breakdowns of every resource dimension to an S3 bucket. From there, AWS Athena or a serverless data integration pipeline can be used to query the raw telemetry, transforming the data and feeding it into your central FinOps dashboard. This is particularly crucial for tracking spot instance interruptions and GPU hour consumption in SageMaker.
Azure Cost Integration:
For Microsoft Azure environments, integrating the Azure Consumption API and the Cost Management API is mandatory. Azure’s architecture shines in its native support for hierarchical management groups, making department allocation slightly more straightforward if the initial Active Directory and subscription architecture was designed correctly. Engineers should utilize the Azure Resource Graph to cross-reference billing data with live infrastructure state, ensuring that transient ML resources (like ephemeral Azure Machine Learning compute clusters) are accurately captured in the dashboard before they are spun down.
GCP Cost Integration:
Google Cloud Platform offers one of the most streamlined approaches for FinOps engineers. By enabling native Cloud Billing export to BigQuery, enterprises immediately gain a highly scalable, SQL-compliant data warehouse of their financial telemetry. Dashboarding tools (such as Grafana, Looker, or custom React frontends) can directly query these BigQuery datasets. GCP’s precise metadata tracking allows for highly accurate mapping of Vertex AI pipeline executions to specific billing line items.
Regardless of the hyperscaler, a fundamental requirement is establishing a unified data layer. Managing enterprise AI API costs seamlessly across multiple clouds requires caching this standardized billing data in a high-performance, time-series database (like Prometheus or ClickHouse). This ensures that when an Enterprise Architect loads the dashboard, the telemetry renders instantly, providing the operational intelligence necessary to make split-second infrastructure decisions.
Transitioning from Reactive to Predictive Budgeting
The final evolution of an Enterprise AI FinOps dashboard is the transition from historical reporting to predictive intelligence. Reactive dashboards tell you how much money was incinerated yesterday; predictive dashboards prevent the infrastructure collapse of tomorrow. As enterprise AI workloads scale, they frequently encounter non-linear cost curves. A slight increase in user traffic can trigger massive auto-scaling events, or a poorly optimized recursive LLM agent can enter an infinite loop, consuming tens of thousands of dollars in hours.
To eliminate this risk, technical leaders must incorporate predictive budgeting and automated anomaly detection into their FinOps architecture. This involves deploying lightweight machine learning models (such as ARIMA, Prophet, or specialized time-series transformers) directly against your standardized billing telemetry. These models establish dynamic baselines for typical compute consumption based on historical patterns, seasonality, and known deployment schedules.
When the FinOps dashboard detects a deviation from this predictive baseline—for example, if a newly deployed NLP model begins consuming GPU memory at a rate that will exhaust the monthly budget in 72 hours—it must trigger an automated incident response. This is where FinOps intersects with Site Reliability Engineering (SRE). Instead of merely sending a passive email alert, the dashboard should integrate with orchestration webhooks to execute defensive architectural maneuvers.
Predictive automated responses might include:
- Traffic Throttling: Temporarily rate-limiting API endpoints that are driving unprofitable inference costs until engineers can optimize the model weights.
- Graceful Degradation: Automatically routing low-priority internal requests to smaller, cheaper, quantized fallback models (e.g., shifting from a 70B parameter model to an 8B parameter model) to preserve compute for customer-facing applications.
- Spot Instance Fallbacks: Shifting non-critical batch processing jobs away from on-demand compute and forcing them to wait for deeply discounted spot instances.
- Circuit Breakers: Hard-stopping rogue training jobs that have exceeded predefined budget thresholds, preventing massive financial waste due to a simple hyperparameter typo.
By transitioning to predictive budgeting, organizations transform their FinOps dashboard from a passive accounting tool into an active, automated defense mechanism. It ensures that compute overhead remains tightly coupled to strategic business objectives. The future of enterprise AI undeniably belongs to those with the most robust, self-regulating infrastructure. Building a sophisticated, API-driven FinOps dashboard is the essential blueprint for achieving that autonomy, allowing teams to scale their intelligence capabilities with absolute financial confidence.


Leave a Reply